Hide code
MyFrame = as.data.frame(
                  cbind(H = seq(0,1000,1),
                        V = rnorm(length(seq(0,1000,1))))
)


library(ggplot2)

ggplot(MyFrame, aes(H,V)) +
  geom_point(col="red")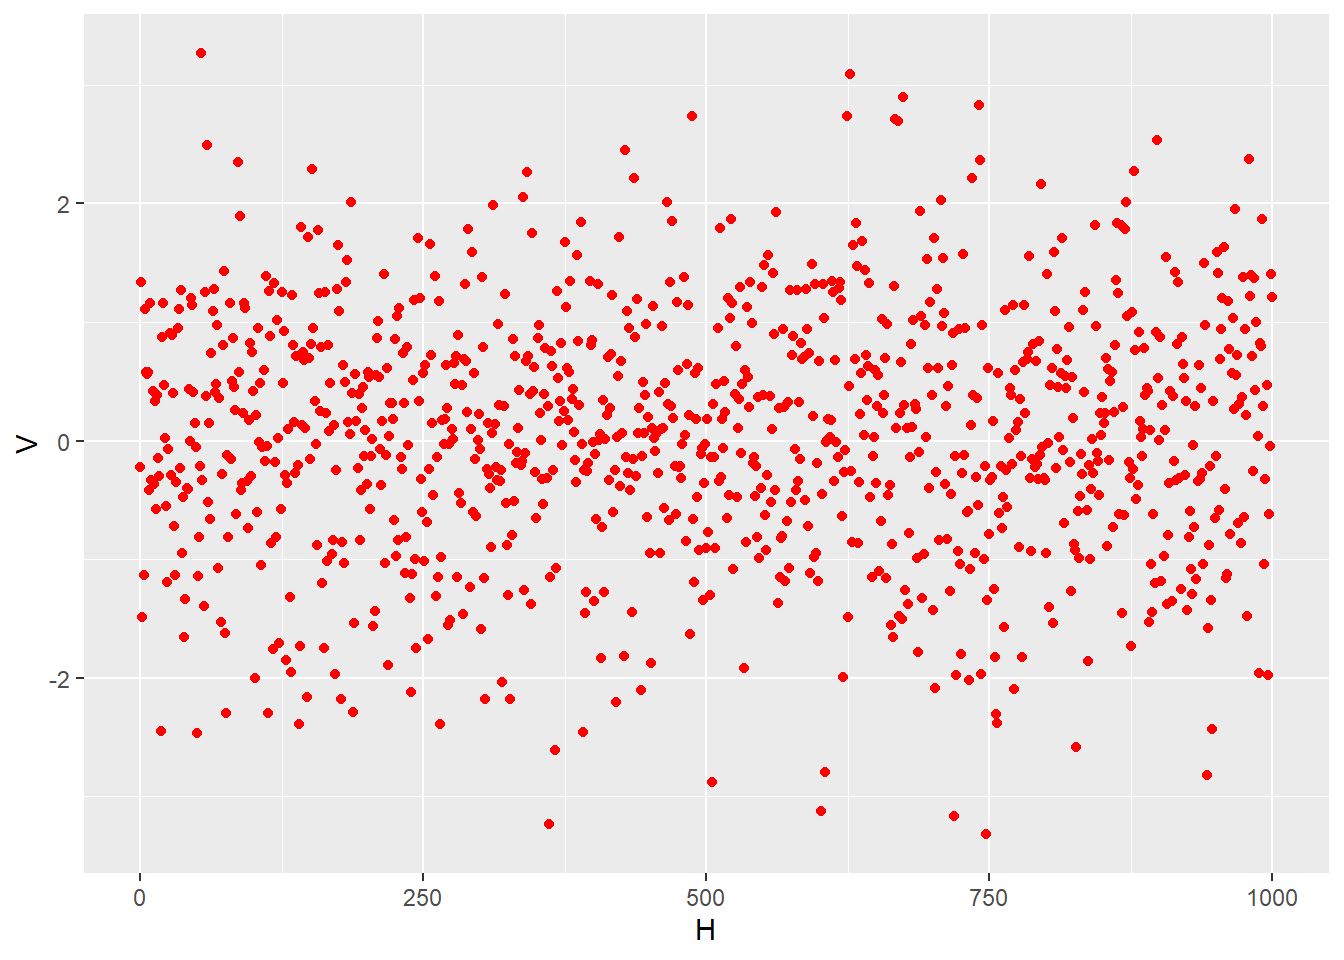
Test text
MyFrame = as.data.frame(
cbind(H = seq(0,1000,1),
V = rnorm(length(seq(0,1000,1))))
)
library(ggplot2)
ggplot(MyFrame, aes(H,V)) +
geom_point(col="red")
Overview
2+3[1] 5Explantion
2+3+3/2[1] 6.5